
查看是否安装了 nginx-vts 模块
/usr/local/nginx/sbin/nginx -V
输出示例:
nginx version: nginx/1.10.0
...
configure arguments: --prefix=/usr/local/nginx --user=nginx --group=nginx --with-stream --with-http_ssl_module --with-http_stub_status_module --with-http_realip_module
安装 nginx-vts 模块
cd /root/
git clone https://github.com/vozlt/nginx-module-vts

cd /usr/local/src/nginx-1.10.0
./configure --add-module=/root/nginx-module-vts --prefix=/usr/local/nginx --user=nginx --group=nginx --with-stream --with-http_ssl_module --with-http_stub_status_module --with-http_realip_module
make
替换旧的 nginx 可执行文件
mv /usr/local/nginx/sbin/nginx  /usr/local/nginx/sbin/nginx.bak.20191211
cp objs/nginx  /usr/local/nginx/sbin/
生成新的 nginx.pid 文件
kill -USR2 `cat /usr/local/nginx/logs/nginx.pid`
停止旧版本 nginx
/usr/local/nginx/sbin/nginx.bak.20191211 -s stop
查看最新的编译参数
/usr/local/nginx/sbin/nginx -V
配置 nginx.conf 暴露监控指标
修改 /usr/local/nginx/conf/nginx.conf 文件:
http {
    ...
    vhost_traffic_status_zone;
    ...
}
创建 nginx-vts-status.conf 配置文件:
vim /usr/local/nginx/conf/vhost/nginx-vts-status.conf
内容如下:
server {
    listen 8088;

    location /status {
        vhost_traffic_status_display;
        vhost_traffic_status_display_format html;
    }
}
重启 nginx
/usr/local/nginx/sbin/nginx -s stop
/usr/local/nginx/sbin/nginx
访问 http://IP:8088/status,可以看到 nginx-vts 统计页面。
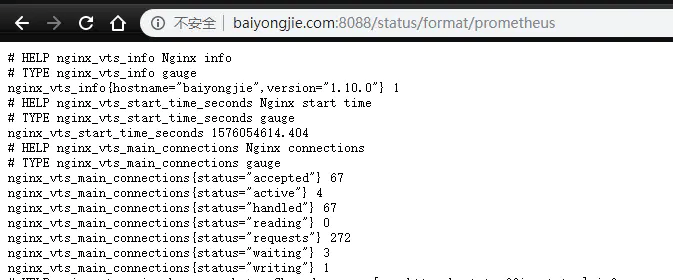
将数据转换为 Prometheus 格式
nginx-vts 提供了 /status/format/prometheus 接口,访问 http://IP:8088/status/format/prometheus 即可获取 metrics 格式数据。
部署 nginx-vts-exporter
wget http://download.baiyongjie.com/linux/prometheus/nginx-vts-exporter-0.10.3.linux-amd64.tar.gz
tar zxvf nginx-vts-exporter-0.10.3.linux-amd64.tar.gz
cp nginx-vts-exporter-0.10.3.linux-amd64/nginx-vts-exporter  /usr/local/node_exporter/
mv nginx-vts-exporter-0.10.3.linux-amd64/ /usr/local/src/
cd /tmp/; nohup /usr/local/node_exporter/nginx-vts-exporter -nginx.scrape_uri=http://127.0.0.1:8088/status/format/json &> /dev/null &
确认 exporter 运行状态
netstat -nptl | grep 9913
验证 exporter 是否返回数据
curl -s 127.0.0.1:9913/metrics | tail
配置 Prometheus
编辑 prometheus.yml 配置文件:
- job_name: 'nginx-vts'
  static_configs:
  - targets:
    - 172.31.217.169:9913
重启 Prometheus 使配置生效:
kill -HUP `ps -ef | grep prometheus | grep -v grep | awk '{print $2}'`
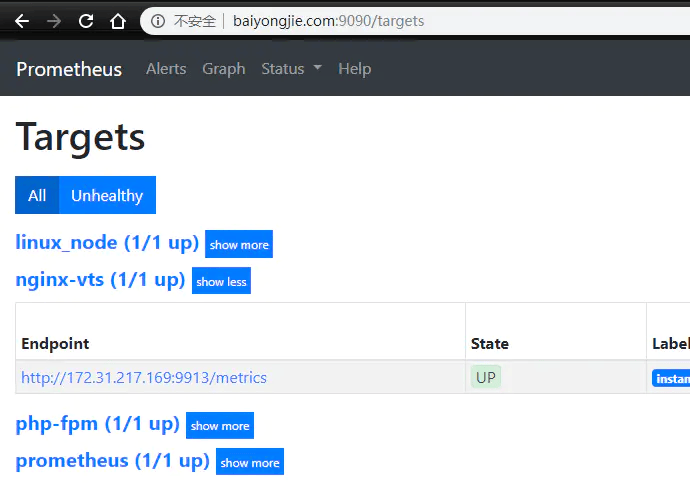
在 Prometheus 界面查询数据
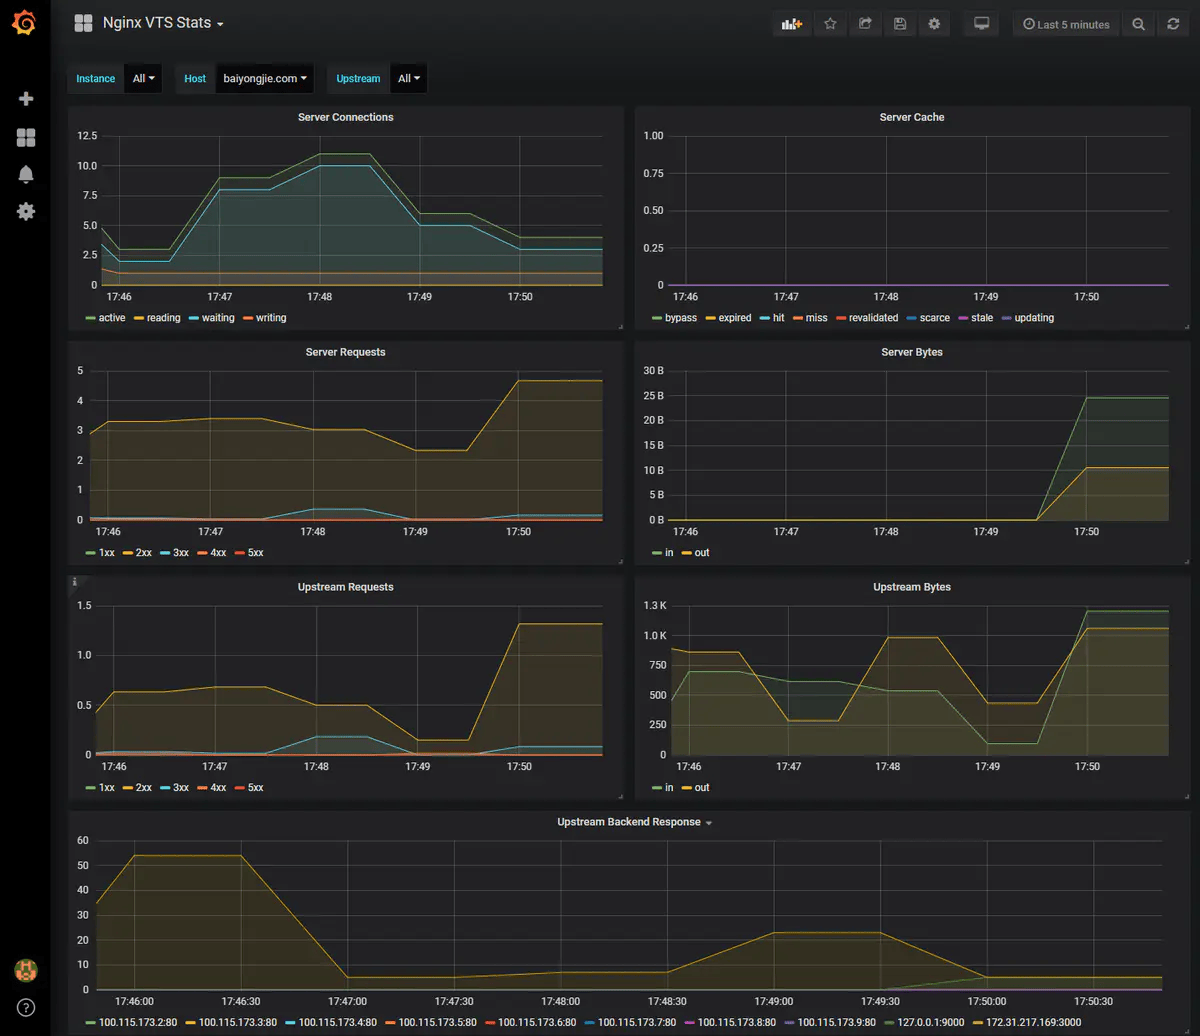
配置 Grafana
在 Grafana 中导入 Dashboard 模板 2949。
安装 GeoIP 模块
yum -y install epel-release geoip-devel

cd /usr/local/src/nginx-1.10.0
./configure --add-module=/root/nginx-module-vts --prefix=/usr/local/nginx --user=nginx --group=nginx --with-stream --with-http_ssl_module --with-http_stub_status_module --with-http_realip_module --with-http_geoip_module
make
检查 nginx 编译参数
/usr/local/nginx/sbin/nginx -V
验证 GeoIP 库是否加载
ldd /usr/local/nginx/sbin/nginx | grep libGeoIP
在 nginx.conf 配置 GeoIP
http {
    ...
    vhost_traffic_status_zone;
    geoip_country /usr/share/GeoIP/GeoIP.dat;
    ...
}
重启 nginx
/usr/local/nginx/sbin/nginx -s stop
/usr/local/nginx/sbin/nginx
通过 VTS 自定义 Key
默认 VTS 只能获取部分指标,如需监控 URI 请求量、IP 访问情况等,可使用 vhost_traffic_status_filter_by_set_key。
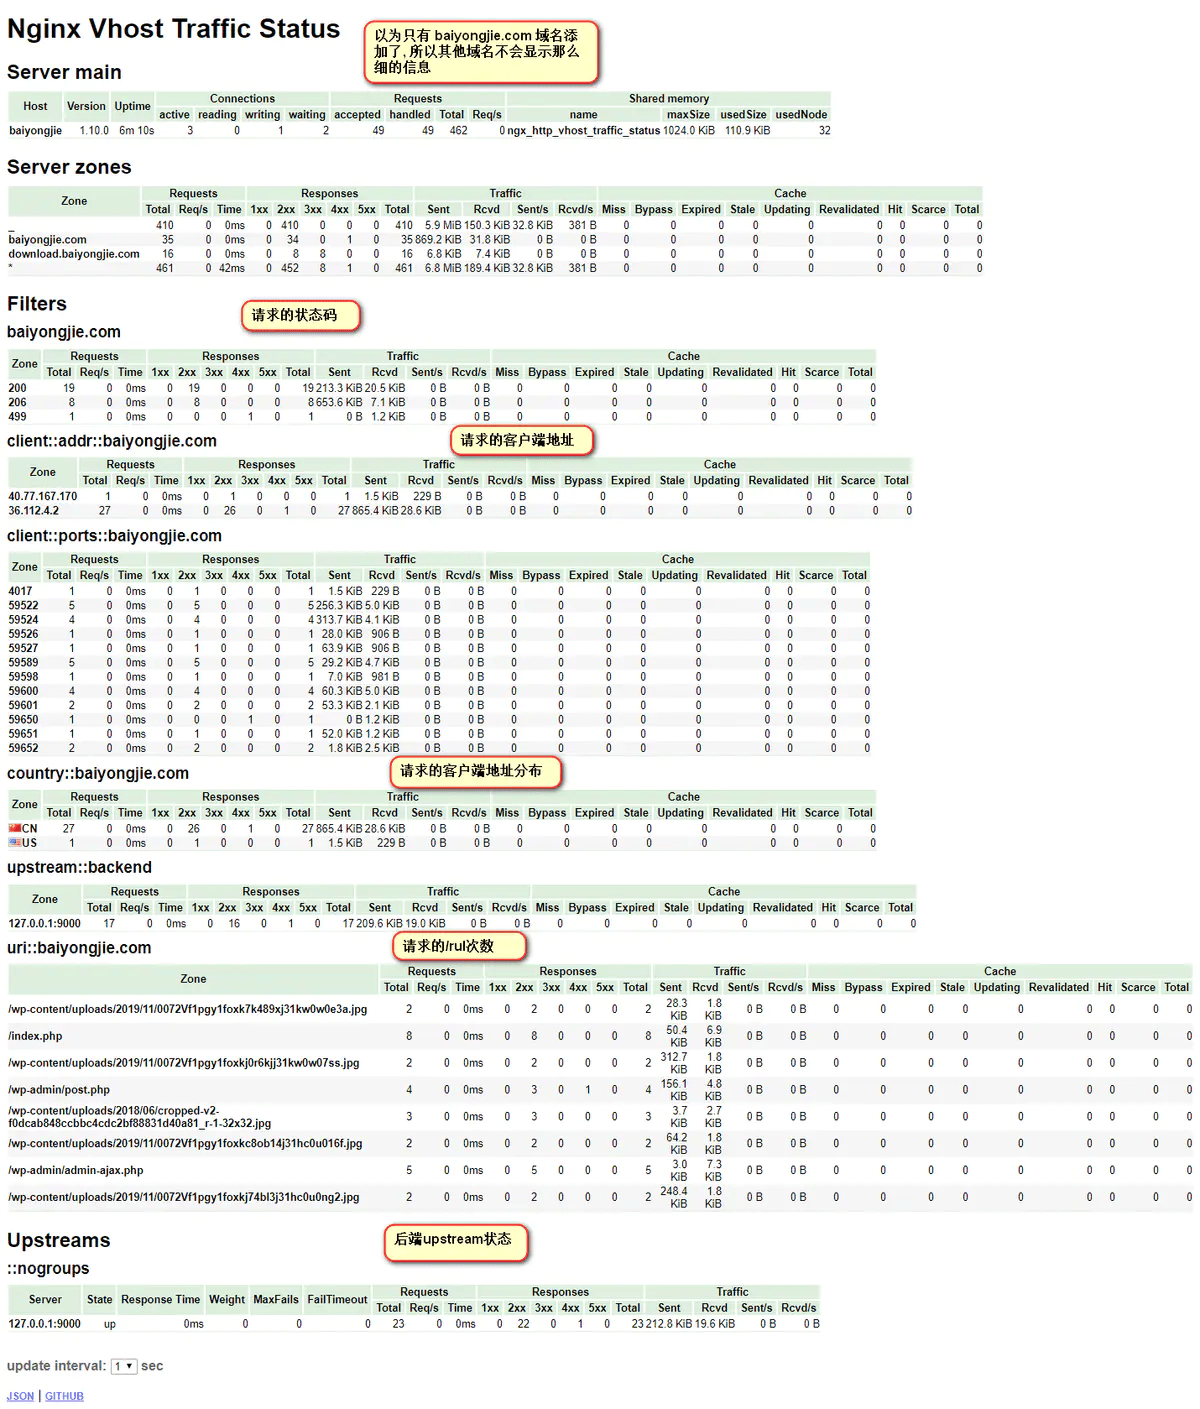
添加自定义监控项
编辑 /usr/local/nginx/conf/vhost/baiyongjie.com.conf:
server {
    listen      443 ssl;
    server_name baiyongjie.com blog.baiyongjie.com;

    ...

    vhost_traffic_status_filter_by_set_key $uri uri::$server_name;  # 每个 URI 访问量
    vhost_traffic_status_filter_by_set_key $geoip_country_code country::$server_name;  # 按国家/区域统计
    vhost_traffic_status_filter_by_set_key $status $server_name;  # HTTP 状态码统计
    vhost_traffic_status_filter_by_set_key $upstream_addr upstream::backend;  # 后端转发统计
    vhost_traffic_status_filter_by_set_key $remote_port client::ports::$server_name;  # 请求端口统计
    vhost_traffic_status_filter_by_set_key $remote_addr client::addr::$server_name;  # 请求 IP 统计

    location ~ ^/storage/(.+)/.*$ {
        set $volume $1;
        vhost_traffic_status_filter_by_set_key $volume storage::$server_name;  # 请求路径统计
    }

    ...
}
验证自定义监控项
再次访问 http://IP:8088/status,可以看到新增的监控数据。 在 Prometheus 查询界面中,能查询到新增的监控指标。
Prometheus 告警规则配置
groups:
- name: nginx_health
  rules:
  - alert: High5xxOnBackend
    expr: rate(nginx_upstream_requests{code="5xx"}[5m]) > 0
    for: 30s
    labels:
      severity: critical
    annotations:
      summary: "{{ $labels.upstream }} 的后端 {{ $labels.backend }} 出现大量 5xx 错误"
规则说明
该 Prometheus 告警规则用于监控 Nginx 上游服务的 5xx 错误。
-
规则名称:
High5xxOnBackend -
触发条件: 过去 5 分钟内
5xx状态码请求速率大于 0,持续 30 秒。 -
严重级别:
critical -
告警信息: 指定
upstream和backend发生 5xx 错误。
可用于监控 Nginx 代理的后端异常情况,触发告警。
评论